
Arithmetic Chapter 2 Pie Chart
A pie chart is a circular statistical graphic which is divided into slices to illustrate numerical proportions.
In a pie chart, the arc length of each slice is proportional to the quantity it represents.
In pie chart values of various datas of components are represented by sectors of a circle. The angle at the centre of the sector gives the value of the data.
Read and Learn More WBBSE Solutions For Class 8 Maths
At the centre, a circle makes a complete angle i.e. 360°.
Centre angle for a data = \(\left(\frac{\text { Value of the data }}{\text { Total value }} \times 360\right)^{\circ}\)
Method of drawing of Pie Chart:
| WBBSE Class 8 English Functional Grammar | WBBSE Class 8 English Reading Skills |
| WBBSE Solutions For Class 8 English | WBBSE Solutions For Class 8 Maths |
- Compute the central angles for the given datas using the above formula.
- Draw a circle with any radius.
- Divide the interior of the circle into different sectors having the angles as obtained (1) with the help of protractor.
- Lable the sections properly to obtain the required pie chart.

Arithmetic Chapter 2 Pie Chart Examples
Example 1. There are 100 students in your class. The following table shows their hobby.
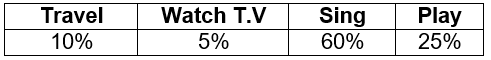
Draw a Pie Chart for the given data.
Solution:
| Hobby | Hobby (in percentage) | Hobby (in fraction) | Central part of 360° |
| Travel | 10 | \(\frac{10}{100}\) = \(\frac{1}{10}\) | \(\frac{1}{10}\) x 360° = 36° |
| Watch T.V | 5 | \(\frac{5}{100}\) = \(\frac{1}{20}\) | \(\frac{1}{20}\) x 360° = 18° |
| Sing | 60 | \(\frac{60}{100}\) = \(\frac{3}{5}\) | \(\frac{3}{5}\) x 360° = 216° |
| Play | 25 | \(\frac{25}{100}\) = \(\frac{1}{4}\) | \(\frac{1}{4}\) x 360° = 90° |
Process:
Draw a circle with any radius (OA).

The central angle of the sector which represents the travel is 36°. So I draw ∠AOB 36° with the help of a protractor.
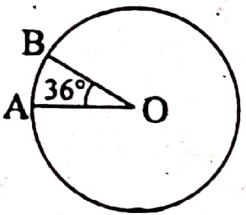
Now, I draw the sectors by reversing the protractor, the central angles of which are 18°, 216° and 90° respectively.
Thus I made a pie chart of the data.
Example 2. Arpita have made a model. She made a chart of expenditures of buying materials.

Make a pie chart with this information and write the central angle of the sectors.
Solution:
| Materials | Expenditure (₹) | Expenditure (in fraction) | The central part of 360° |
| Art paper | 9 | \(\frac{9}{60}\) = \(\frac{3}{20}\) | \(\frac{3}{20}\) x 360° = 54° |
| Sketch pen | 12 | \(\frac{12}{60}\) = \(\frac{1}{5}\) | \(\frac{1}{5}\) x 360° = 72° |
| Scissor | 25 | \(\frac{25}{60}\) = \(\frac{5}{12}\) | \(\frac{5}{12}\) x 360° = 150° |
| Colour ribbon | 6 | \(\frac{6}{60}\) = \(\frac{1}{10}\) | \(\frac{1}{10}\) x 360° = 36° |
| Pitch board | 8 | \(\frac{8}{60}\) = \(\frac{2}{15}\) | \(\frac{2}{15}\) x 360° = 48° |
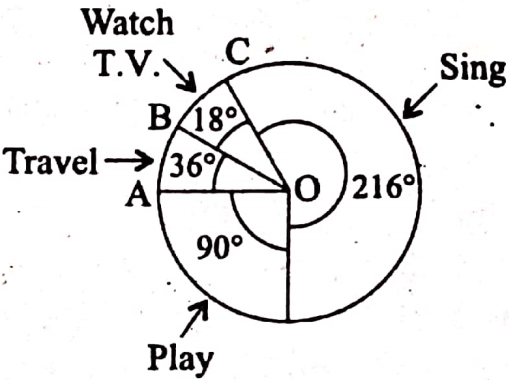
Example 3. The pie chart of what kind of programmes Information News the audience likes:
- Write How many parts of the total circular region is the sector of the audience who watch news in the pie chart?
- Write what kind of programme gets the most audience.
- Write what kind of programme gets the least audience.
- Write how many parts of the total audience watch the programmes of sports?
Solution:
- No. of parts of total circular region is the sector of the audience who watch news in the pie chart is \(\frac{20}{360}\) or \(\frac{1}{18}\)
- Entertaining programmes gets the most audience. [Entertained is 240°]
- Informative programme gets the least audience.
- \(\frac{90}{360}\) or \(\frac{1}{4}\) parts of the total audience watch the programmes of sports.
Example 4. Choose the correct Answer:
1. Pie Chart is also known as
- Circle graph
- Histogram
- Bar graph
- None of these
Answer: 1. Circle graph
2. Central angle for data
- \(\frac{\text { Total value }}{\text { Value of the data }} \times 360^{\circ}\)
- \(\frac{\text { Value of the data }}{\text { Total value }} \times 360^{\circ}\)
- \(\frac{\text { Value of the data }}{\text { Total value }} \times 100^{\circ}\)
- None of these
Answer: 2. \(\frac{\text { Value of the data }}{\text { Total value }} \times 360^{\circ}\)
3. A survey was made to find of music lovers like. If 20 people like classical music the number of people surveyed is
- 100
- 200
- 50
- 10
Answer: 2. 200

Example 5. Fill in the blanks:
1. Pie chart is also known as _______ graph.
Answer: Circle chart.
2. Study the following table below:

Measurement of central angle of Santro is ________
Solution: Measurement of central angle of santro is \(\left(\frac{6}{36} \times 360^{\circ}\right)=60^{\circ}\)
Answer: 60°
Example 6. Write ‘True’ or ‘False’.
1. Pie chart is a bar graph.
Answer: False
2. The whole circle represents the sum of the value of the components.
Answer: True