
Algebra Chapter 8 Double Bar Graph
The following data gives the number of students of class in their choice of Subjects in Percentage has been made.
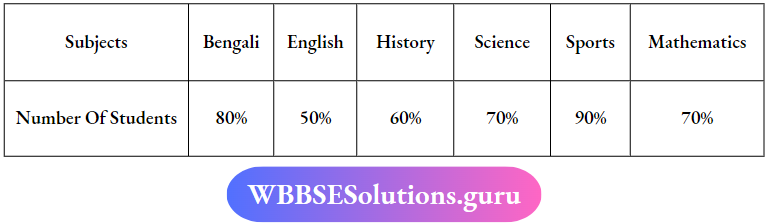
Represent the above data with the help of a bar graph and answer the following questions.
Question 1. Choose the correct answer
1. Number of students who like mathematics.
- 50%
- 60%
- 70%
- 80%
Solution: 3. 70%
The option (3) 70%. is the Correct Answer.
Read and Learn More Class 7 Maths Solutions

2. Studenns like most.
- Mathematics
- Bengali
- English
- Sports.
Solution: 4. Sports.
Option (4) Sports is the correct Answer

Class 7 Algebra Problems With Solutions
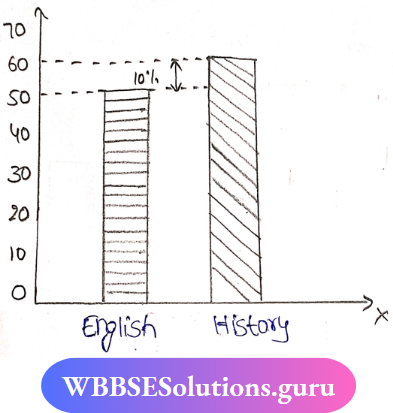
Question 2. Write true or False:
- 10% more Students like History than English.
- Most of the students like Bengali.
Solution:

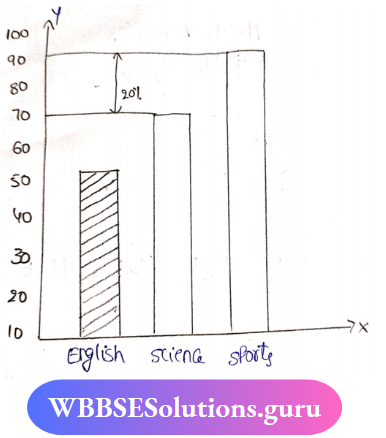
Question 3. Fill in the Blanks.
1. ______ % of Students like English.
Solution: 50%
2. ______ % of more students like sports than science.
Solution: 20%
Algebra Formulas For Class 7 WBBSE
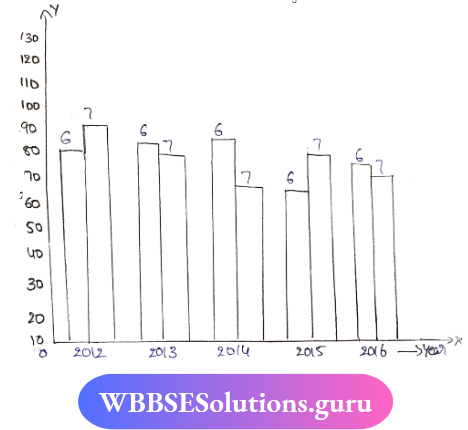
Question 4. The results of the pass percentage of class 6 and class 7 in the annual examination for 5 years of our school are given in the following table.
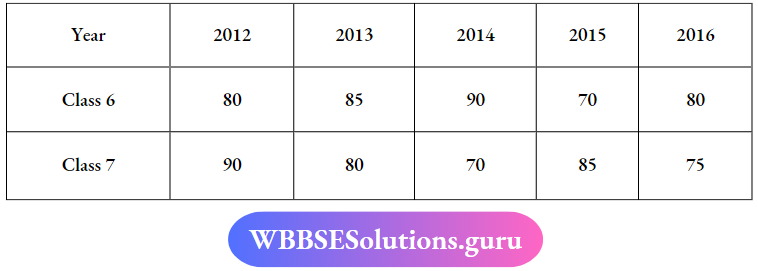
Drawbar graphs to represent the data.
Question 5. The Students of a school have got the numbers in mathematics and English in the Madhyamik Examination in the year 2014-2018 are given below:
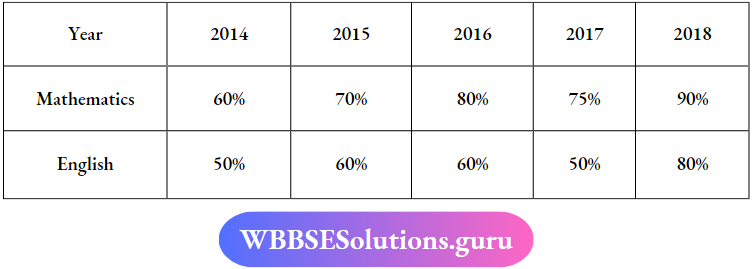
Draw the bar graphs to represent the data.

WBBSE Maths Study Material Class 7
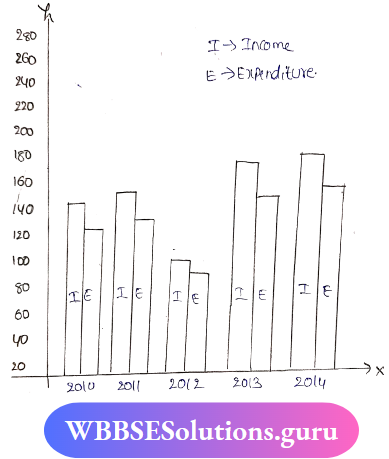
Question 6. The income and expenditure for 5 years of a family. is given in the following data.
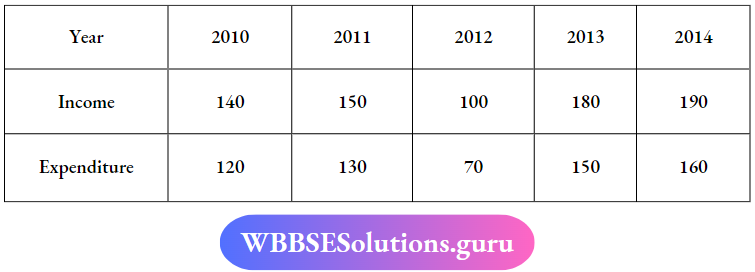
Represent the above data with a bar graph
Question 7. The production of the Saha Textile factory from the month of January to June is given below.

Express the above information on a bar graph.

Class 7 Maths Exam Preparation WBBSE
Question 8. Read the following bar graph and answer the following questions:
Scale: 1unit 100 books
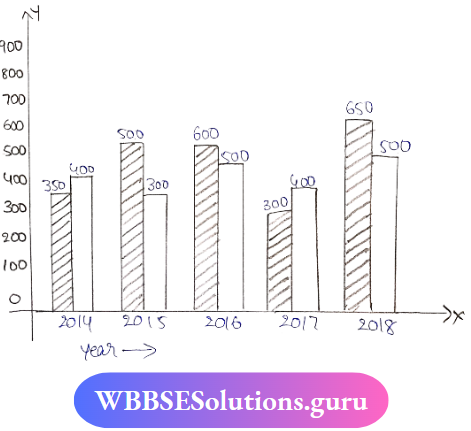
1. Write the change in the requirement of Textbooks during the year from 2014 to 2018
Solution: 2400
2. Find in which year it will sell of storybooks maximum ad in which year it was the least
Solution:
Sell of story books maximum in the year 2018
Sell of story books least in the year 2015
3. In which year does the difference between the number of story books and textbooks sold maximum and in Which Year is this difference maximum?
Solution:
The maximum number of story books and textbooks sold in the year of difference is 2015
The minimum difference between the story and textbooks sold in the year is 2014