
Algebra Chapter 7 Graphs
⇒ Graphs are pictorial representations of mathematical data and relations.
⇒ To construct a graph some sort of graph paper is used. The graph paper is divided into small squares.
Read and Learn More WBBSE Solutions For Class 8 Maths
⇒ To locate the exact position of a point we need two number lines that are perpendicular to each other, they are called co-ordinate axes.
⇒ The horizontal number line XOX’ is called X-axis and the vertical number line YY’ is called Y axis.
⇒ The point O at which the two axes intersect is called the origin.

⇒ The region within angle XOY is called 1st quadrant.
⇒ The region within angle YOX’ is called 2nd quadrant.
⇒ The region within the angle X’OY’ and Y’OX are called 3rd and 4th quadrants respectively.
| WBBSE Class 8 English Functional Grammar | WBBSE Class 8 English Reading Skills |
| WBBSE Solutions For Class 8 English | WBBSE Solutions For Class 8 Maths |
⇒ We get the distance from Y-axis is X coordinate and the distance from X-axis is Y.
⇒ The X coordinate is called the abscissa and the Y coordinate is called the ordinate.
⇒ The coordinate of origin O is (0, 0).
⇒ Signs of abscissa and ordinate in the quadrants is shown.

To find out the points (6, 5), (-4, 5), (- 10, -5), (7,-4)
Solution:

1. To plot the point (6,5)
- I drew two axis X’OX and YOY’ on the graph paper. The intersection of two axes (0, 0).
- From O (0, 0) we moved 6 units to the right side along X-axis, and then from the point we moved 5 units above along the line parallel to Y-axis and reached at the point P its position is (6, 5).
2. To plot the point (-4, 5) from O(0, 0) we moved 4 units to the left side along X-axis, and then from the point we moved 5 units above along the line parallel to Y-axis and reached at the point Q, its position is (-4, 5).
3. To plot the point (- 10, 5) from 0 (0, 0) we moved 10 units to the left side along X-axis, and then from the point we moved 5 units below along the line parallel to Y-axis and reached at the point R, its position is (-10, -5).
4. To plot the point (7,-4) from O(0, 0) we moved 7 units to the right side along X-axis, and then from the point we moved 4 units below along the line parallel to Y-axis and reached at the point S, its position is (-7,-4).
Plot the points (5, 0), (0, 4), (- 3, 0), and (0, -6),
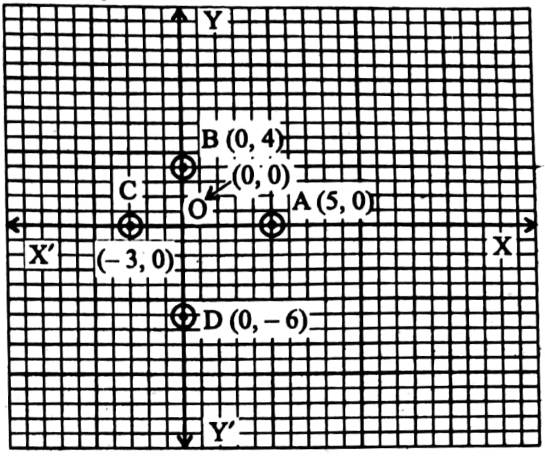
1. point A (5, 0) is at 5 unit away from origin (0, 0) on the X-axis.
∴ The distance of point A from the Y-axis is 5 units and from X-axis is 0 unit.
∴ The coordinates of point A is (5, 0).
2. The point B (0, 4) is at 4 unit away from the origin (0, 0) on Y-axis.
The distance of point B from the X-axis is 4 unit and from Y-axis is 0 unit.
∴ The coordinate of point B is (0, 4).
3. The point C (-3, 0) is at 3 unit away from origin on X-unit towards left.
∴ The distance of point C from Y-axis is 3 unit and from X-axis is 0 unit.
∴ The coordinate of C is (-3, 0).
4. The distance of point D from X-axis is 6 unit and from Y-axis is 0 unit.
∴ The coordinate of point D is (0,-6).
Algebra Chapter 7 Graphs Examples:
Example 1. If
- Plot points (3, 4), (-6, -1), and (8, 7) on the graph paper and see whether they are collinear.
- Put three non-collinear points on the graph paper.
- Put three more collinear points other than D the above three collinear points on the graph paper and write their coordinates.
Solution:

1. The points (3, 4), (-6, -1), and (8, 7) are plotted on the graph paper.
⇒ We join these three points by a straight line AB.
⇒ Hence these three points are collinear.
2. Three non-collinear points (-9, 4), (3, 8), and (12, 3) are plotted on the graph paper.
3. Three more collinear points (- 5, 7), (9, 4), and (11, 8) other than the above three collinear points are plotted and these three points are joint by a straight line CD.
Example 2. See the graph on the graph paper beside and find the answers to the questions below:
1 guava = length of the smallest squares along X-axis and 1 rupee = length of a side of one smallest square along Y-axis.
- Write the relation between the number of guava and the price of guava from the graph.
- Write the price of 4 guava.
- Write the number of guavas in 30 from the graph.
- Write the number of guavas in 9.
Solution:
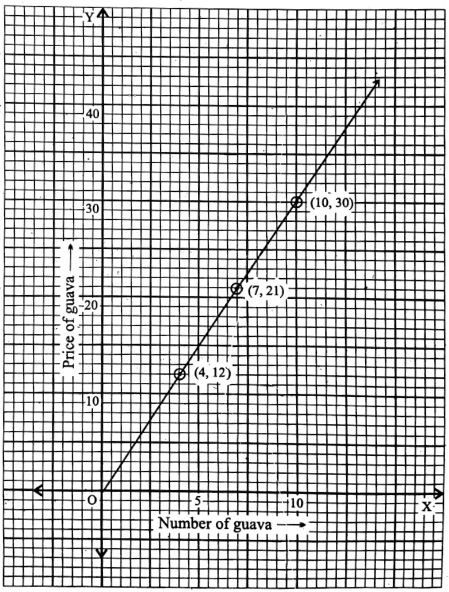
- As the number of guava increases then the price of guava also increases. So the price of guava is proportional to the number of guavas.
- The price Price of 4 guavas is 12.
- The number of guavas in 30 is 10.
- The number of guavas in 9 is 3.
Example 3. Draw the graph on the graph paper of the following data and see whether it is a linear graph. Also, find out the price of 6 books and the number of exercise books for Rs. 100 from the graph.

Solution:
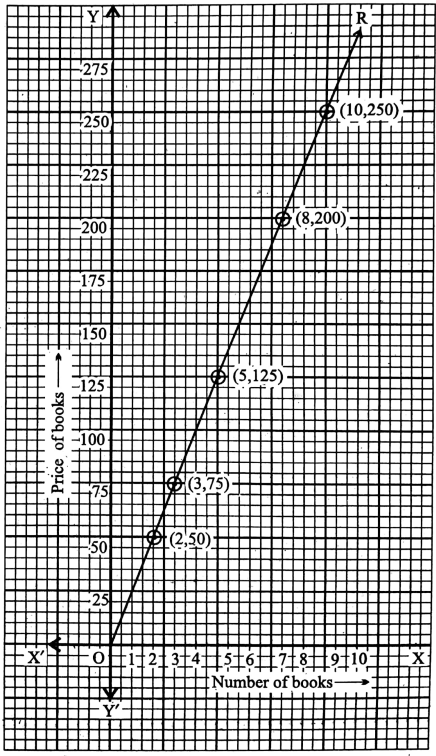
- At first drawing X-axis and Y-axis we took a scale along the two axis.
- Let’s we consider the length of a side of the smallest square along X-axis = 2 books and length of the side of the smallest square along Y-axis = 5 rupees.
- From given data let’s plot (2, 50), (3, 75), (5, 125), (8, 200), and (10, 250) in the graph paper.
- Joining the points, we got a straight line, segment PQ. So it is a linear graph.
From the graph, the price of 6 books is 150 and the number of books for 100 is 4.
Example 4. If Draw the graph of y = x + 2.
Solution: y = x + 2
Tabulation:
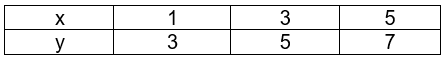

1 small division on X-axix and Y-axis = 1 unit.
⇒ First, we plot the point A (1, 3), B (3, 5) C (5, 7), then we find A, B, and C which are colinear (PQ).
Example 5. Draw the graph, y = 6.
Solution: y = 6 means for any real value of x, value of y is always 6.
Tabulation:


Taking 1 small division 1 unit on both the axes we plot P (5, 6), Q (0, 6), R (7, 6) and join P, Q, R which is a linear graph.
Example 6. Choose the correct answer:
1. Value of abscissa of each point on the y-axis is
- 0
- 1
- -1
- None of these
Solution: Correct answer is 1. 0
2. Value of the ordinate of each point on the X-axis is
- 1
- 0
- -1
- None of these
Solution: Correct answer is 2. 0
3. (2, 3) lies on
- 2nd quadrant
- 3rd quadrant
- 1st quadrant
- None of these
Solution: Correct answer is 3. 1st quadrant
Example 7. Write ‘True’ or ‘False’:
1. (-2, 0) lies on the 2nd quadrant.
Solution: The statement is true.
2. A lies on X-axis, its abscissa is always zero.
Solution: The statement is false.
3. A (5, 7) and B (7, 5) are same points.
Solution: The statement is false.
Example 8. Fill in the blanks:
1. (0, 2) lies on the _________ side of Y axis.
Answer: Positive.
2. The line joining (1, 1), (2, 2) passes through _________
Answer: Origin.
3. Position of a point was first thought by _________
Answer: Rene Descartes.